This repository contains:
- A Jupyter notebook (made in Google Colab) which works through different plot types
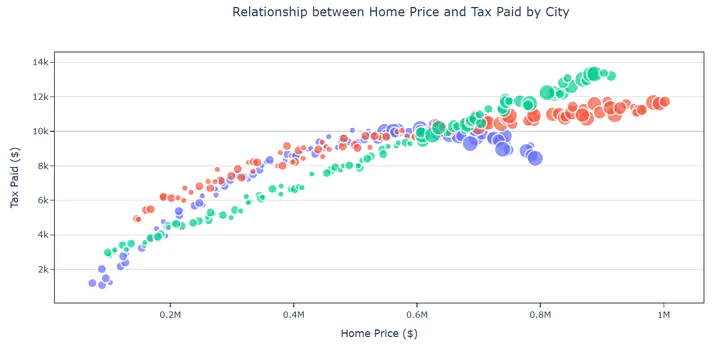
- Contains four different plot types (bar graph, histogram, line graph, scatter plot)
- Builds the figures out from simple to complex
- Also contains Plotly code to make interactive figures